How to Know If Your Deployed Model Is Actually Still Working

You've probably lived some version of this…
You spent weeks (or months) on the model. You defined the problem, cleaned the data, engineered the features, trained the model, and hit a score you were happy with. You deployed it. Congratulations. That was Phase 1.
Now you're in Phase 2, and nobody prepared you for what it actually looks like:
- Someone upstream quietly changes a field in an API
- A feature you rely on gets redefined in another team's pipeline
- The distribution of your incoming data slowly shifts
- Your model keeps returning predictions, without complaint
- The dashboard still looks fine
- Weeks later, a stakeholder asks why the numbers feel off
- You dig in and realize your model has been wrong for weeks
Most data scientists learn this side of the work on the job, weeks too late. After something went wrong. After the damage was already done.
The skills that close the gap aren't taught in most tutorials: monitoring inputs and outputs, drift detection, alerting on the right signals, and versioning what changes. You don't need all of MLOps for this. You just need to take ownership past the deploy step.
That's what this lesson is about.
The four layers of ML monitoring
Effective ML monitoring covers four layers, in order of increasing complexity and increasing importance. Each layer catches a different class of failure. Missing any one of them leaves a blind spot.
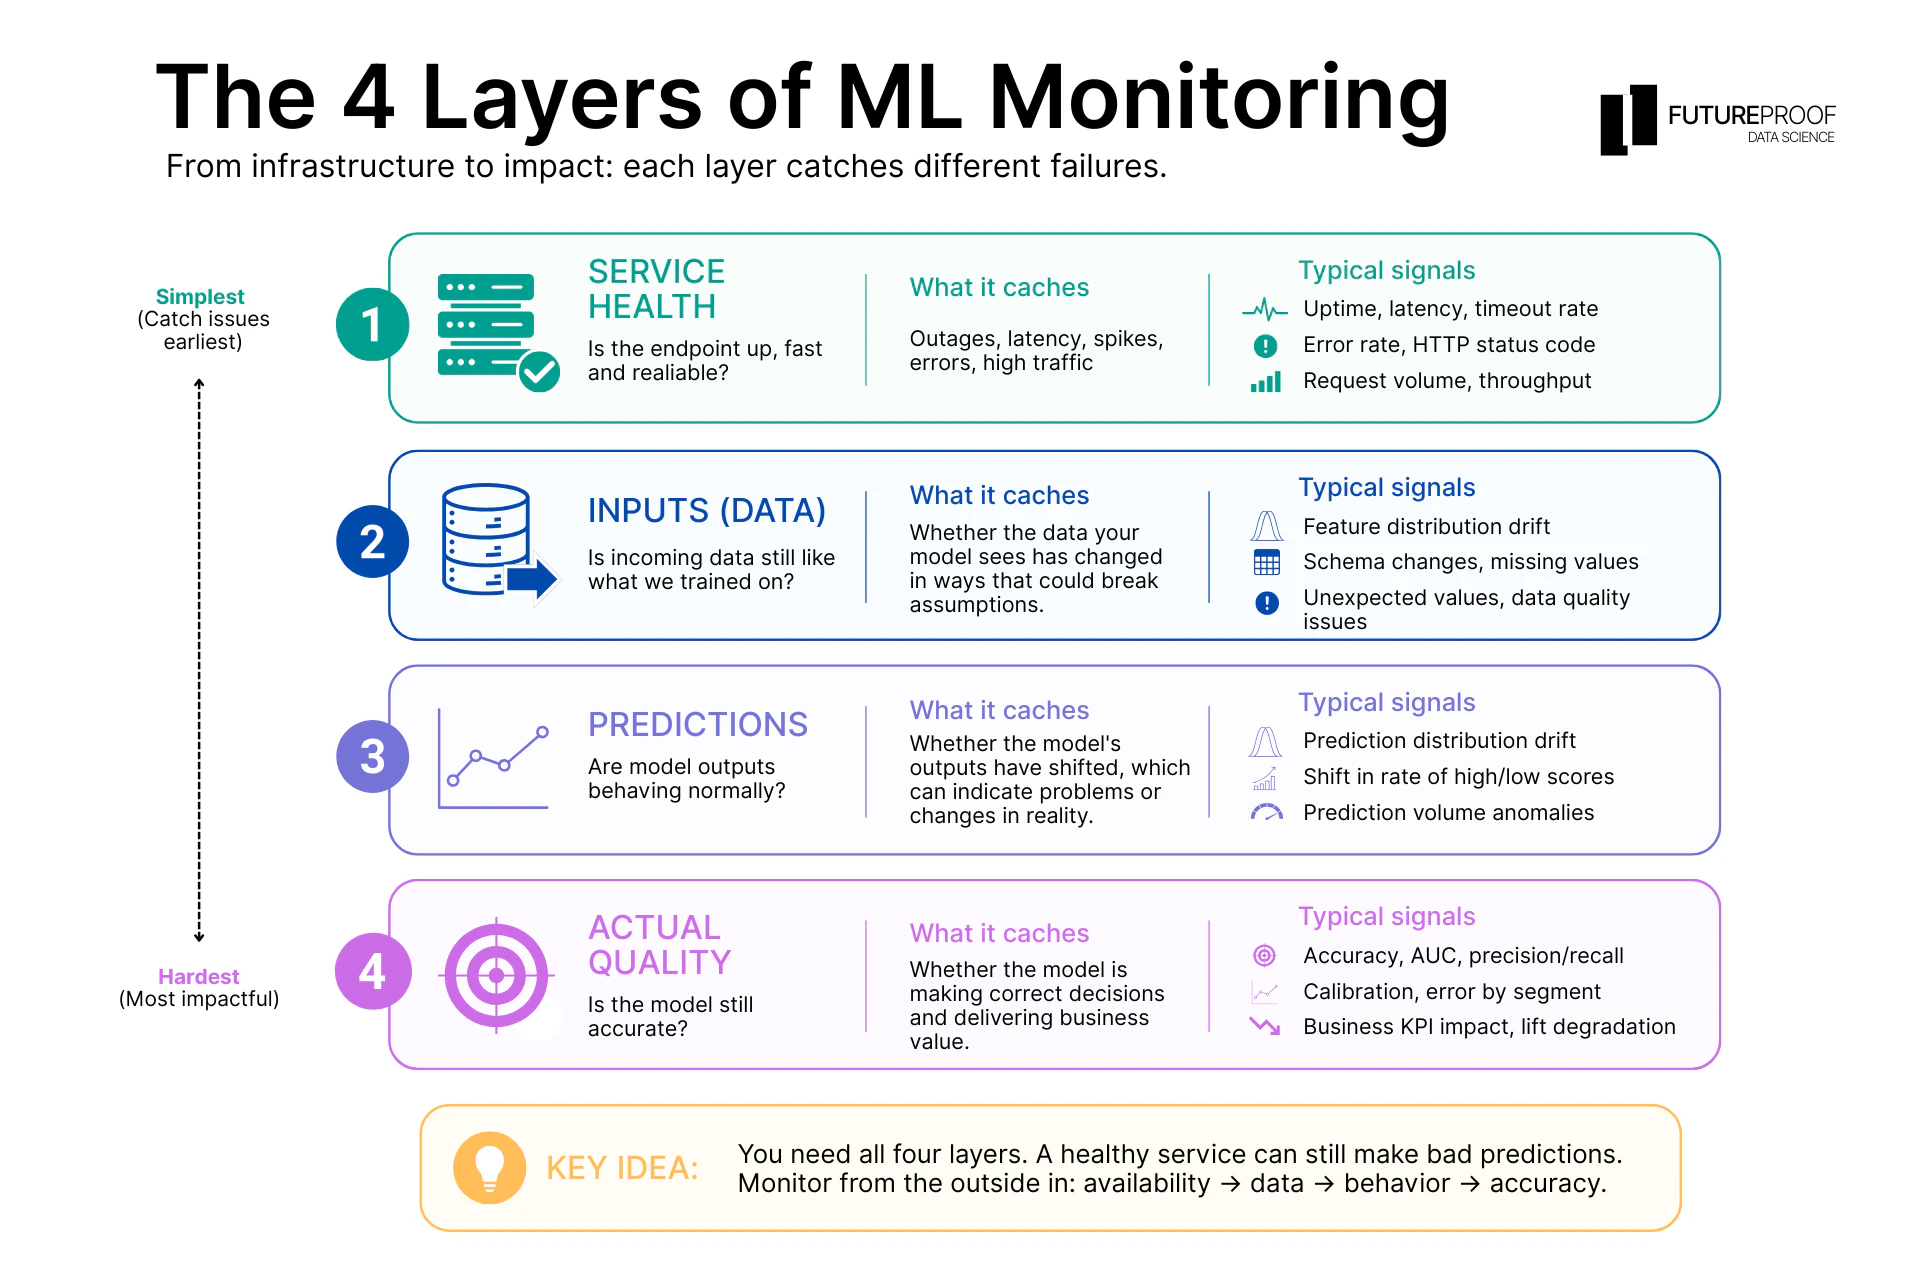
Here's the stack, from simplest to hardest:
- The service itself: is the endpoint up, responding, and fast? This is standard software monitoring: uptime, latency, error rate, request volume. Tools like Datadog, Prometheus, and CloudWatch handle this. If your service crashes or slows down, you'll know.
- The inputs: is the data coming into your model still shaped like what you trained on? A model trained on customers aged 25-45 that starts receiving requests for customers aged 60+ is being asked a question it wasn't designed to answer. This is data drift.
- The predictions: is the distribution of your model's output still normal? If your churn model used to predict 8% high-risk customers and now predicts 22%, something changed. Maybe the world changed. Maybe your model is wrong. Either way, you need to know. This is prediction drift.
- The actual quality: once you have ground truth (the customer actually churned, the fraud actually happened, the click actually occurred), you can measure whether your model was right. This is the layer that answers "is my model still accurate?", and it's the hardest because ground truth often arrives with a delay.
Layer 1 is what most teams already have. Layers 2-4 are what separates a service that's "up" from a model that's "working." The rest of this lesson walks through each of the ML-specific layers and what to actually do about them.
Data drift: when the world shifts under your model
Data drift is the most common cause of silent model degradation, and it's the one you can catch earliest. The idea is simple: your model was trained on data that had certain statistical properties (distributions, ranges, correlations). If the data coming into production drifts away from those properties, your model is operating outside its training envelope, and its predictions become less reliable.
What causes data drift
A few common triggers, all of which have happened to real teams:
- Upstream data pipeline changes: Someone on another team refactors a feature. What used to be
revenue_last_30_daysis nowrevenue_last_28_days. Nothing broke. Your model just started receiving slightly different numbers. - Real-world distribution shifts: Seasonality. New user segments coming online. A marketing campaign that brings in a demographic your model has never seen.
- Source system changes: An upstream API silently changes the type of a field (integer to string). Your service still works, but the parsed value is now nonsense.
- Silent schema evolution: A new category value appears in a field that used to only have three possible values. Your one-hot encoding doesn't know what to do with it.
None of these will crash your service. None of them will trigger a standard alert. And every one of them will quietly degrade your model.
Detecting drift with Evidently AI
The most common open-source tool for this in 2026 is Evidently AI. It compares two datasets (a reference and a current one) and tells you which features have drifted, by how much, and with what statistical significance.
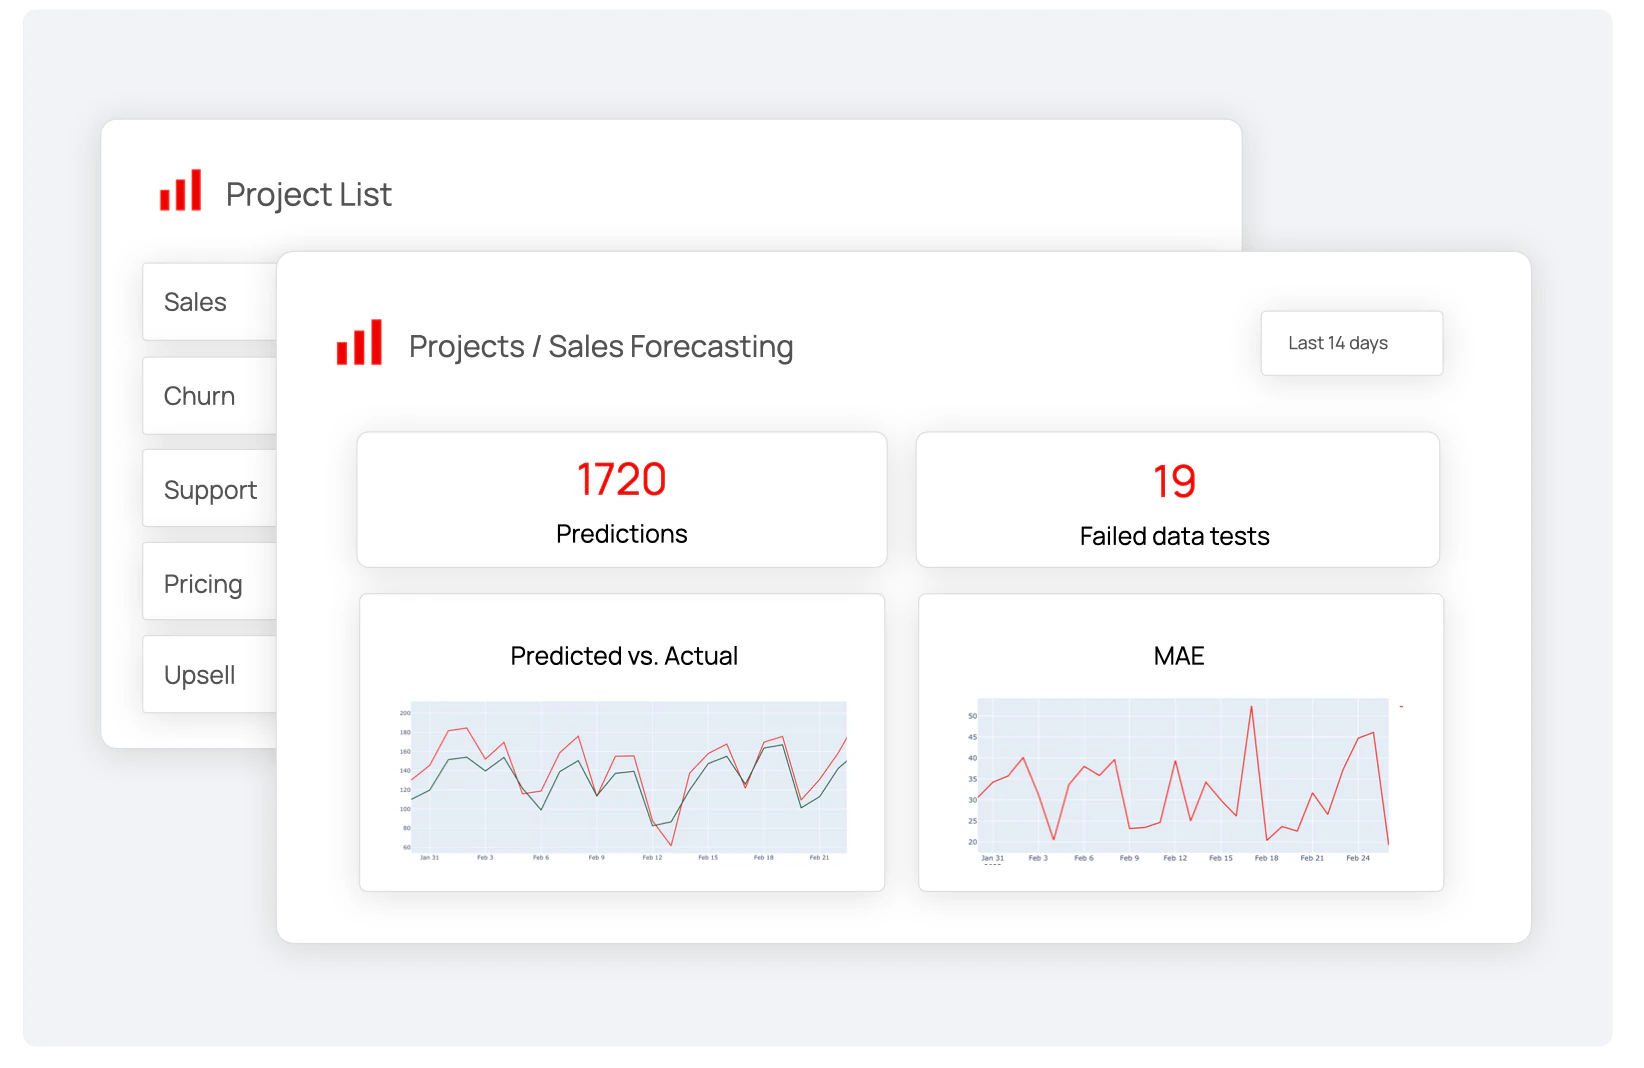
Here's the simplest useful version:
from evidently import Report, Dataset, DataDefinition
from evidently.presets import DataDriftPreset
import pandas as pd

# Load your training data (the reference) and recent production data
reference_data = pd.read_csv("data/03_processed/training_data.csv")
current_data = pd.read_csv("data/03_processed/production_last_7_days.csv")

# Wrap them as Evidently datasets
reference = Dataset.from_pandas(reference_data, data_definition=DataDefinition())
current = Dataset.from_pandas(current_data, data_definition=DataDefinition())

# Build and run the drift report (the order is current, then reference)
report = Report([DataDriftPreset()])
result = report.run(current, reference)

# Save it as an HTML report you can open in a browser
result.save_html("reports/drift_report.html")
The output is a browsable HTML report showing which features drifted, along with distribution comparisons for each. You can look at it manually, or you can extract the pass/fail signal and use it as a trigger.
If any critical feature drifts significantly, you have your answer: something in the world has changed, and your model might need to see it.
For production teams that want managed drift monitoring with alerting built in, the paid options are Weights & Biases, Arize, and Fiddler. They add dashboards, alerting, and integration with your existing pipeline. Evidently on its own gets you 80% of the way there for free.
Prediction drift: the early warning signal
Prediction drift is what it sounds like: the distribution of your model's outputs is shifting, even if inputs look roughly the same.
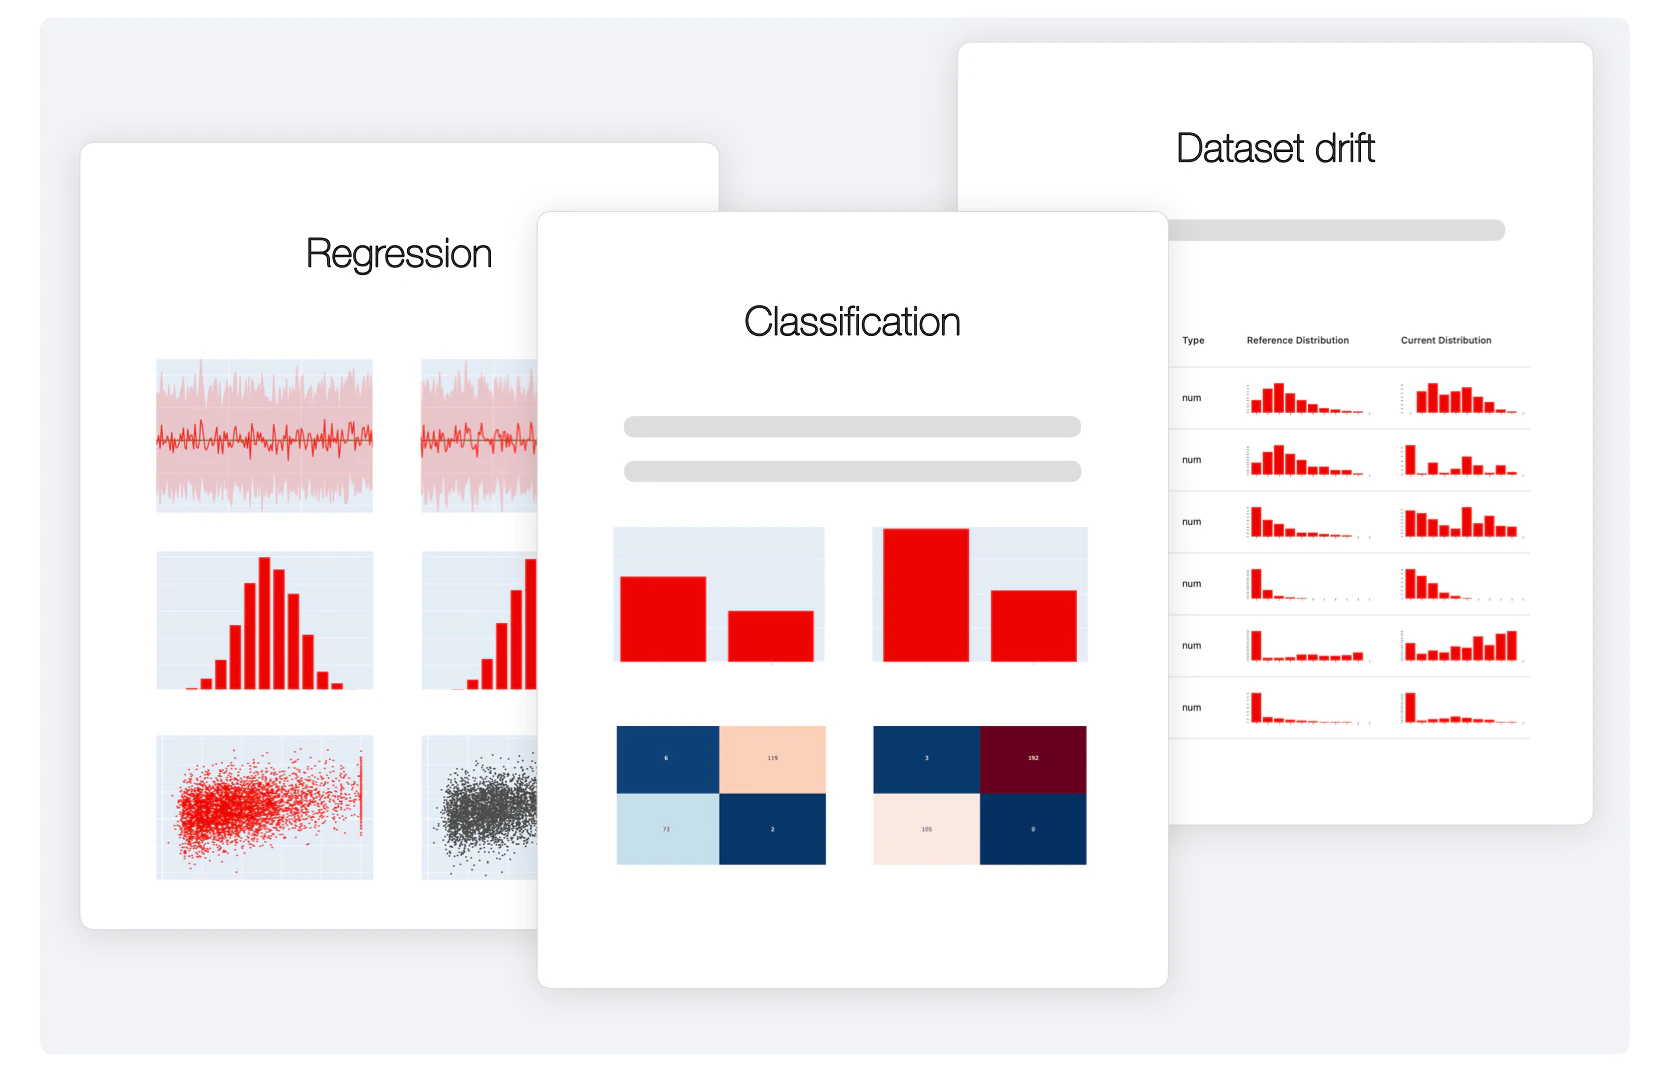
This matters for a specific reason. In many ML problems, you don't get ground truth right away. A churn model predicts churn today, but you don't know if the customer actually churned for 30 or 60 days. During those weeks, prediction drift is your earliest signal that something has changed.
If your churn model has been predicting 8% high-risk customers for months and this week it's predicting 22%, something is different. Maybe it's a legitimate real-world shift (a competitor launched, a pricing change went live). Maybe the model is reacting badly to drifted inputs. Either way, you want to know now, not in six weeks when the actual churn numbers land.
Detecting prediction drift uses the same statistical machinery as data drift, just applied to the output column. Evidently handles this natively:
from evidently.metrics import ValueDrift

# Reuse the reference/current datasets from above, now checking only the output column
report = Report([ValueDrift(column="churn_probability")])
result = report.run(current, reference)
result.save_html("reports/prediction_drift.html")
The result tells you whether your model's predictions have shifted in aggregate. A significant shift is a flag to investigate, even if you don't yet know whether the model is right or wrong.
Concept drift: the failure your drift reports can miss
There's one more kind of change, and it's the most dangerous, because your drift reports can stay completely green while it happens.
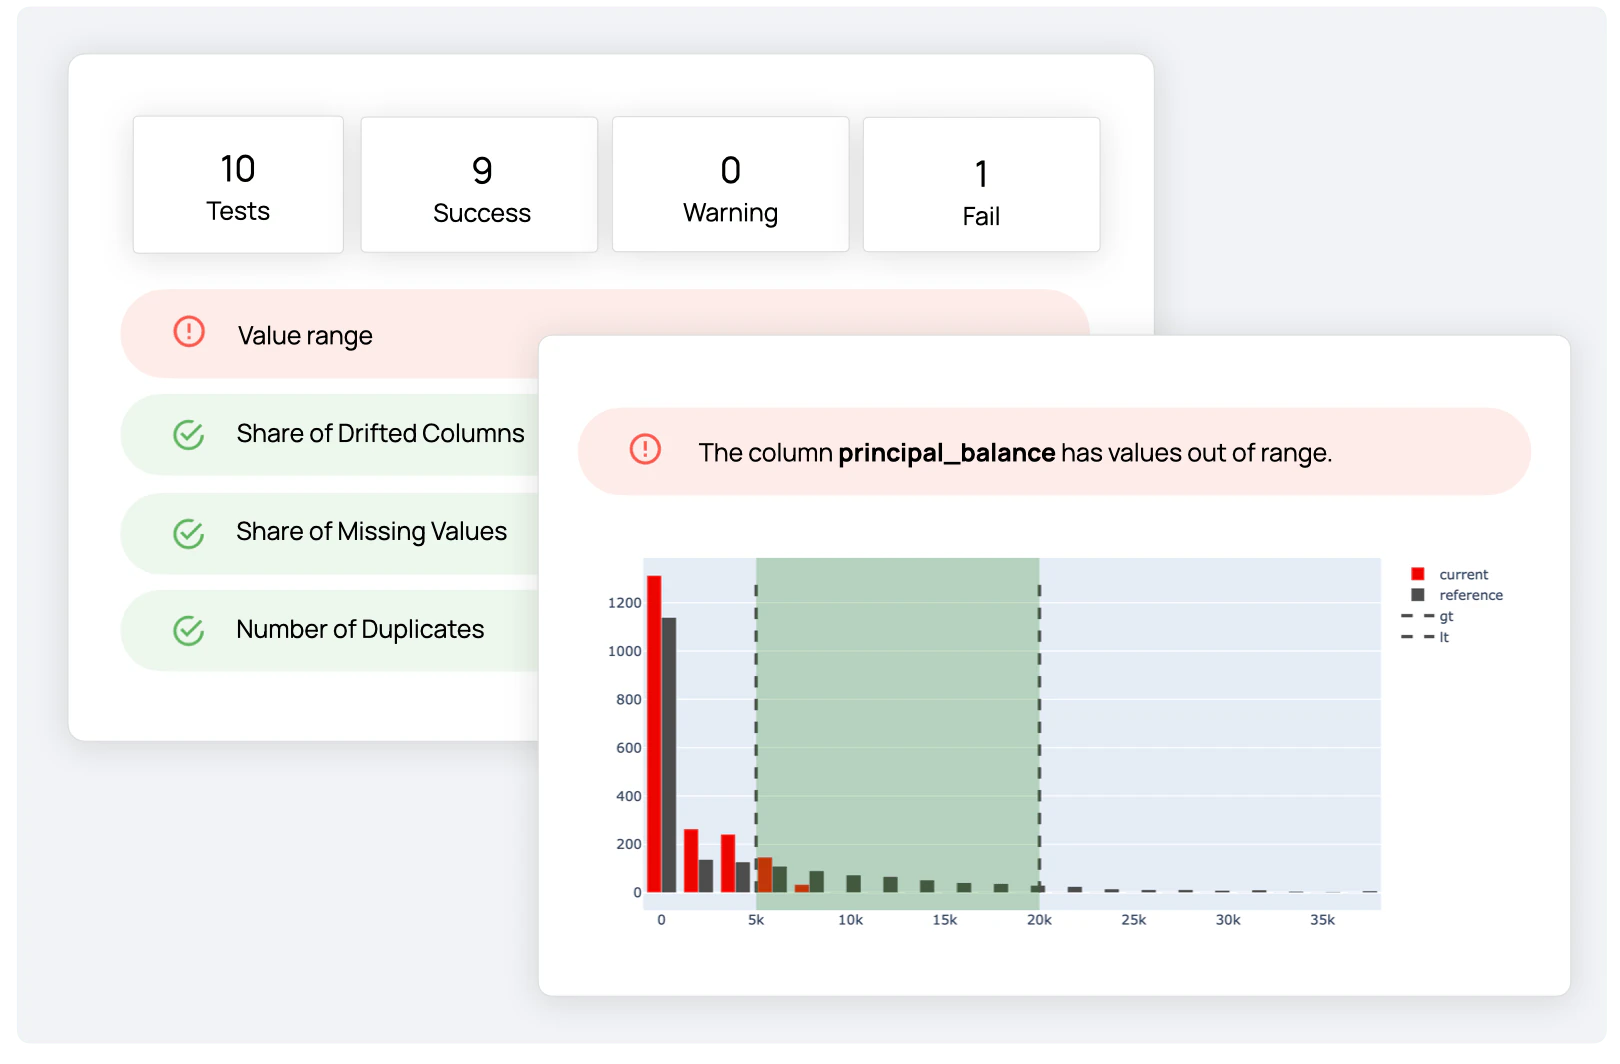
Data drift and prediction drift both watch distributions: the shape of your inputs, the shape of your outputs. Concept drift is different. It's when the relationship between your inputs and the thing you're predicting changes, even though the inputs themselves look exactly like they always did.
An example. Your churn model learned that customers on short tenures churn the most. Then a competitor launches an aggressive win-back campaign, and now it's your long-tenured, high-value customers leaving instead. The incoming data looks identical to training: same age ranges, same income, same tenure distribution. Evidently flags nothing. But the model is now wrong, because what "a churner looks like" has changed underneath it.
This is the honest limit of drift detection. Data and prediction drift catch the cases where the world visibly shifts. Concept drift can slip right past them. The only thing that catches it is comparing your predictions against what actually happened, which is the layer we turn to next.
The ground truth problem: measuring actual quality
Data drift and prediction drift are proxies. They tell you something has changed, but not whether your model is right or wrong. The layer that answers that question is performance monitoring, and it's the hardest because it requires ground truth.
Fast feedback loops vs slow feedback loops
The kind of monitoring you can do depends on how fast ground truth arrives.
- Fast feedback loops (hours to days): Recommendation systems, click prediction, ad ranking, fraud detection with immediate transaction outcomes. You know within hours whether the user clicked, bought, or the transaction was fraudulent. Monitoring here is straightforward: log the prediction, wait for the label, compare.
- Slow feedback loops (weeks to months): Churn prediction, loan default, disease diagnosis, sales forecasting. You wait a long time for the ground truth to be observable. During that wait, you're flying blind on actual accuracy, which is why data drift and prediction drift matter so much for these problems.
For fast-feedback problems, you can compute rolling accuracy metrics in near real-time. For slow-feedback problems, you can't. You have to lean on the proxy signals (data drift, prediction drift) and accept a lag before you can confirm quality has actually degraded.
Practical patterns for hard cases
When ground truth is slow or expensive, teams use a few common patterns:
- Sampled human review: Randomly sample a small percentage of predictions and have a human label them for ground truth. Expensive but reliable.
- Shadow labels: Deploy a second model (or a rule-based system) in parallel and compare its outputs to yours. Divergence is a signal.
- Business metric proxies: Track downstream business outcomes (revenue, conversion, retention) that your model was meant to influence. If those metrics move, your model probably moved too.
None of these fully solves the ground truth problem. All of them buy you visibility you wouldn't otherwise have.
When drift shows up: retraining and rollback
Monitoring is only useful if you do something with the signal, but the first thing to do is decide whether the signal even matters. Not every drift flag is a problem. Distributions move for benign reasons all the time (seasonality, a marketing push, a normal shift in your traffic), and with enough production data your tests will flag something almost constantly. The skill that separates useful monitoring from noise is deciding which flags are worth acting on, and tuning your alerts so you're not crying wolf. Chase every flag and you'll end up muting the whole dashboard, which puts you right back to flying blind.
Once you've decided a change is real and worth acting on, there are two responses: retrain or rollback. Which one you reach for depends on what you think caused it.
Retraining
If the world has genuinely shifted (new user segments, seasonal changes, real-world distribution changes), your model needs to see the new data. Retrain on recent data, evaluate against a held-out set, and promote the new version if it beats the current champion.
Two common patterns:
- Scheduled retraining: retrain on a fixed cadence (weekly, monthly). Simple, predictable, catches gradual drift.
- Triggered retraining: retrain when drift signals cross a threshold. More responsive, more infrastructure to build.
For most solo data scientists and small teams, scheduled retraining is the pragmatic starting point. Automated retrain-on-drift is aspirational and requires more infrastructure than most teams have on day one.
When the new model is trained, promote it through your MLflow registry (from Lesson 3): assign the @champion alias to the new version. Your service picks up the new champion on its next restart, no service code changes needed.
Rollback
If drift showed up right after your last deployment, or if a newly promoted model is performing worse than the previous one, rollback is the answer. This is where the work you did in Lessons 3 and 4 pays off.
Rolling back looks like this:
- Move the
@championalias in your MLflow registry back to the previous version - Trigger your CI/CD pipeline (from Lesson 4), which redeploys the container pointing at the now-current champion
- Verify the rollback worked and the metrics recover
Minutes, not hours. No manual container rebuilds. No SSH sessions. Just moving a pointer in the registry and letting the pipeline do the rest.
This is what MLOps maturity looks like: you notice a problem, you have a mechanism to respond, and the response is fast enough to matter.
Try it on your own
I put together a Colab notebook that runs drift detection end to end. It builds a reference and a current dataset, runs an Evidently report, then simulates drift and watches it get flagged, both data drift and prediction drift. Open it and run the cells top to bottom.
- Run the baseline report and see a healthy model: nothing drifts.
- Simulate data drift (older customers start showing up, the age distribution shifts) and watch Evidently flag the exact feature.
- Read the signal in code: pull the pass/fail out of the report, the boolean you'd wire into an alert or a retraining trigger.
- Check prediction drift on the
churn_probabilityoutput, the early-warning signal for slow-feedback problems like churn.
Then take it back to your own service: log real predictions, point the reference at your training data, and run this on a schedule. When drift shows up, you retrain and promote a new champion, or roll back the alias, using the registry and pipeline from Lessons 3 and 4. Write those rollback steps down now, not once things break.
If you finish steps 1-5, you have a monitoring loop that most solo data scientists never build. You'll know when your model is drifting, you'll know what to do about it, and you'll have a rollback plan that takes minutes instead of hours.
Final thoughts
Zoom out on what you've built across the five lessons of this course:
- Lesson 1: a reproducible project with a lockfile and structured layout
- Lesson 2: a callable, containerized service around your model
- Lesson 3: a versioned model registry that decouples "which model is running" from the service code
- Lesson 4: a CI/CD pipeline that automates deployment when code or models change
- Lesson 5: monitoring that closes the loop by watching what happens after deploy
This is the shape of MLOps end-to-end. Every piece connects to the ones around it. Your project structure feeds your Dockerfile. Your Dockerfile feeds your service. Your service loads from your registry. Your CI/CD pipeline is triggered by changes to either the code or the registry. Your monitoring feeds signals back into retraining and rollback, which feed the registry, which feeds the pipeline. It's a loop.
If you take one thing from this final lesson, let it be this: a shipped model without monitoring isn't a shipped model, it's a liability with a countdown timer. The service is up, the endpoint responds, and everything looks fine. Until the day it doesn't, and by then the damage has been done.
Most data scientists never learn this side of the work. They stop at Phase 1 and hope Phase 2 works itself out. It doesn't. The teams that ship reliably are the ones that take ownership past the deploy step, and the difference between those two mindsets is a huge amount of the value you can offer as a data scientist in 2026 and beyond.
This is the end of the free course. You now have the shape of MLOps. You know what each piece is for, why it exists, and how they connect. That's a real foundation, and it's enough to start applying this work in your job today.
What's next is the depth. Taking each piece from "I understand the shape" to "I can build this in production, at scale, with the details that catch most people off guard." That's where the full bootcamp picks up, and I'll say more about that in a follow-up email.
For now: thank you for going through this with me. Take what you've learned, apply it to a real project, and start closing the gap between "I trained a model" and "I operate a system in production."
If you'd rather do this end to end with support and feedback, take a look at the ML in Production bootcamp.